Dashboards
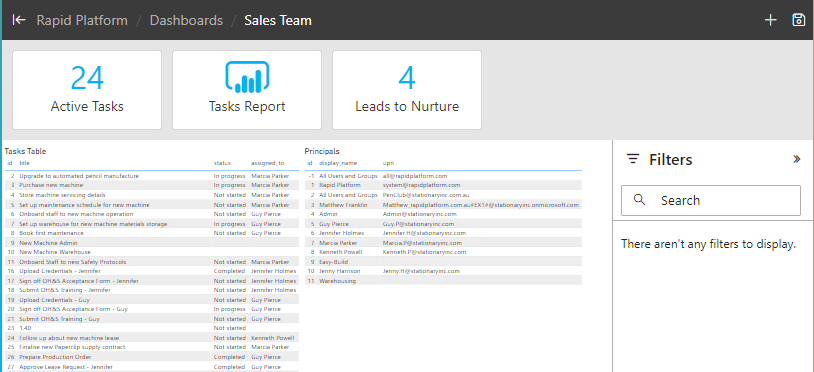
Dashboards provide a useful way to group a set of reports and/or views. If you find yourself looking at the same set of things in Explorer regularly, consider creating a dashboard.

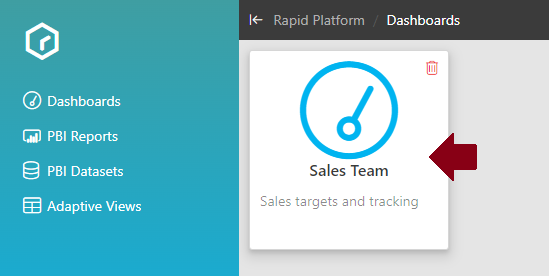
Creating a new Dashboard
- Press the Add New + button in the top right

- Give your new dashboard a title and description
- Click on the newly created dashboard card to open it up

Populating a Dashboard
Dashboards store three different things; PowerBI reports, Views and Adaptive Views. These will be kept at the top of your dashboard in the form of cards.
To add a new card:
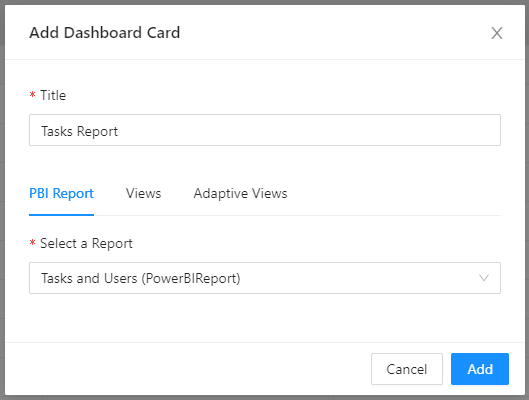
- Press the Add Dashboard Card button in the top right
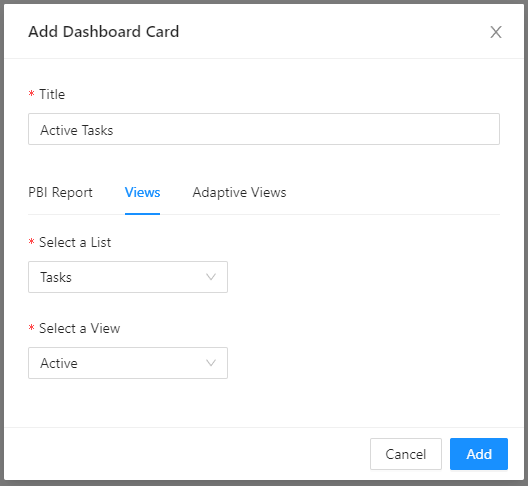
- Give your new card a title
- Select the type of card you want to add
For PowerBI Reports and Adaptive Views, select an existing Report/Adaptive View against your site and press Add to finalise the card.

For Views, select the List (Table) and then select the View you want to display and press Add to finalise the card. View cards will show the count of rows within the view to make it easy at a glance to tell what is going on in a dashboard.

After adding a card press the Save button in the top right to save your changes.

To remove a card, just press the red tash can icon on the top right. This only will appear on hover.